Release notes
OpsProbe v0.2.4: Monitor Cockpit and scoped Overview.
Released on August 2, 2026, v0.2.4 turns the console into clearer product surfaces: Overview shows conclusions, and Monitors show instrument-style health detail.
Quick answer
OpsProbe v0.2.4 completed the Monitor Cockpit UI, narrowed Dashboard/Overview to high-level conclusions, added public documentation screenshots, and clarified which monitor signals are live today versus planned for future paid tiers.
What changed today
- Overview no longer repeats Sites, Monitors, Checks, Incidents, or Reports content.
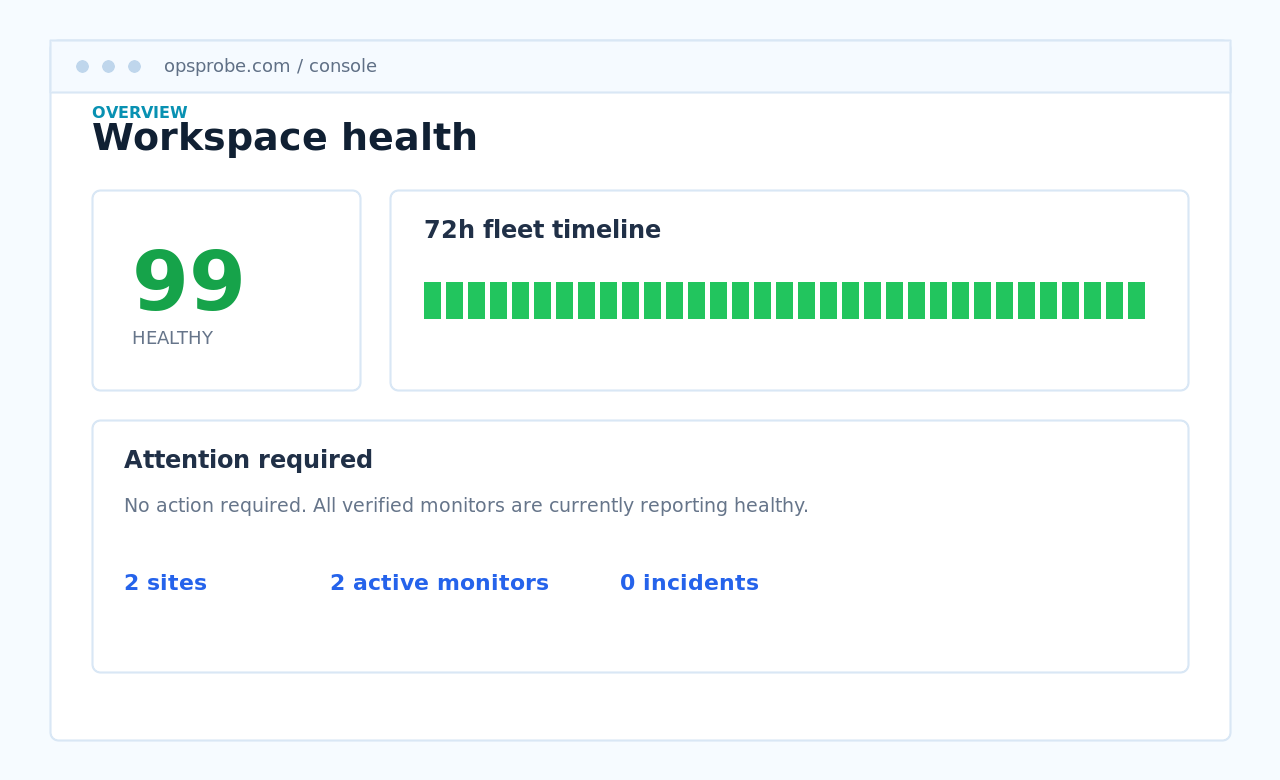
- Overview shows workspace health, 72-hour timeline, key metrics, and attention-required items.
- Monitors now use a cockpit-style card with health score and 72-hour status strip.
- Monitor facts now include 72-hour uptime, average latency, p95 latency, and last failure.
- The signal matrix labels HTTP availability as live and DNS, SSL, port, business flow, and AI analysis as planned.
- Public docs now include local screenshot assets for Overview and Monitor Cockpit.
Console preview
Why this matters
Dashboard should answer whether the workspace is healthy. Monitor pages should answer whether a specific monitored signal is healthy. Raw checks should stay diagnostic. This release fixes that information boundary so the product can grow without turning every page into the same dashboard.
Verification
- Frontend syntax check completed with node --check.
- Whitespace validation completed with git diff --check.
- Release check completed for v0.2.4.
- Production health and readiness endpoints were verified after deployment.
- GitHub tag and release were published for v0.2.4.
Known limits
DNS, SSL, port exposure, business-flow monitoring, AI analysis, alert delivery, escalation, audit logs, team roles, usage limits, and billing are still planned and are not executed by v0.2.4.